Industry analysis · April 2026

The MRO Super Cycle:
Why Autonomous Inspection
Is Inevitable.

By the ARACHNID Systems team · ~10 min read · April 6, 2026

The global aviation maintenance market is moving from $119.7B in 2025 to $156B by 2035. The world fleet is climbing from 29,000 to 38,300 aircraft. Average fleet age is at 13.4 years and rising. And the certified-mechanic pool in North America is short 18,500 today, projected to double to 37,000 missing by 2028. Four structural curves are bending at once — and they do not solve with hiring. This is the MRO super cycle, and it is why autonomous inspection stops being optional.

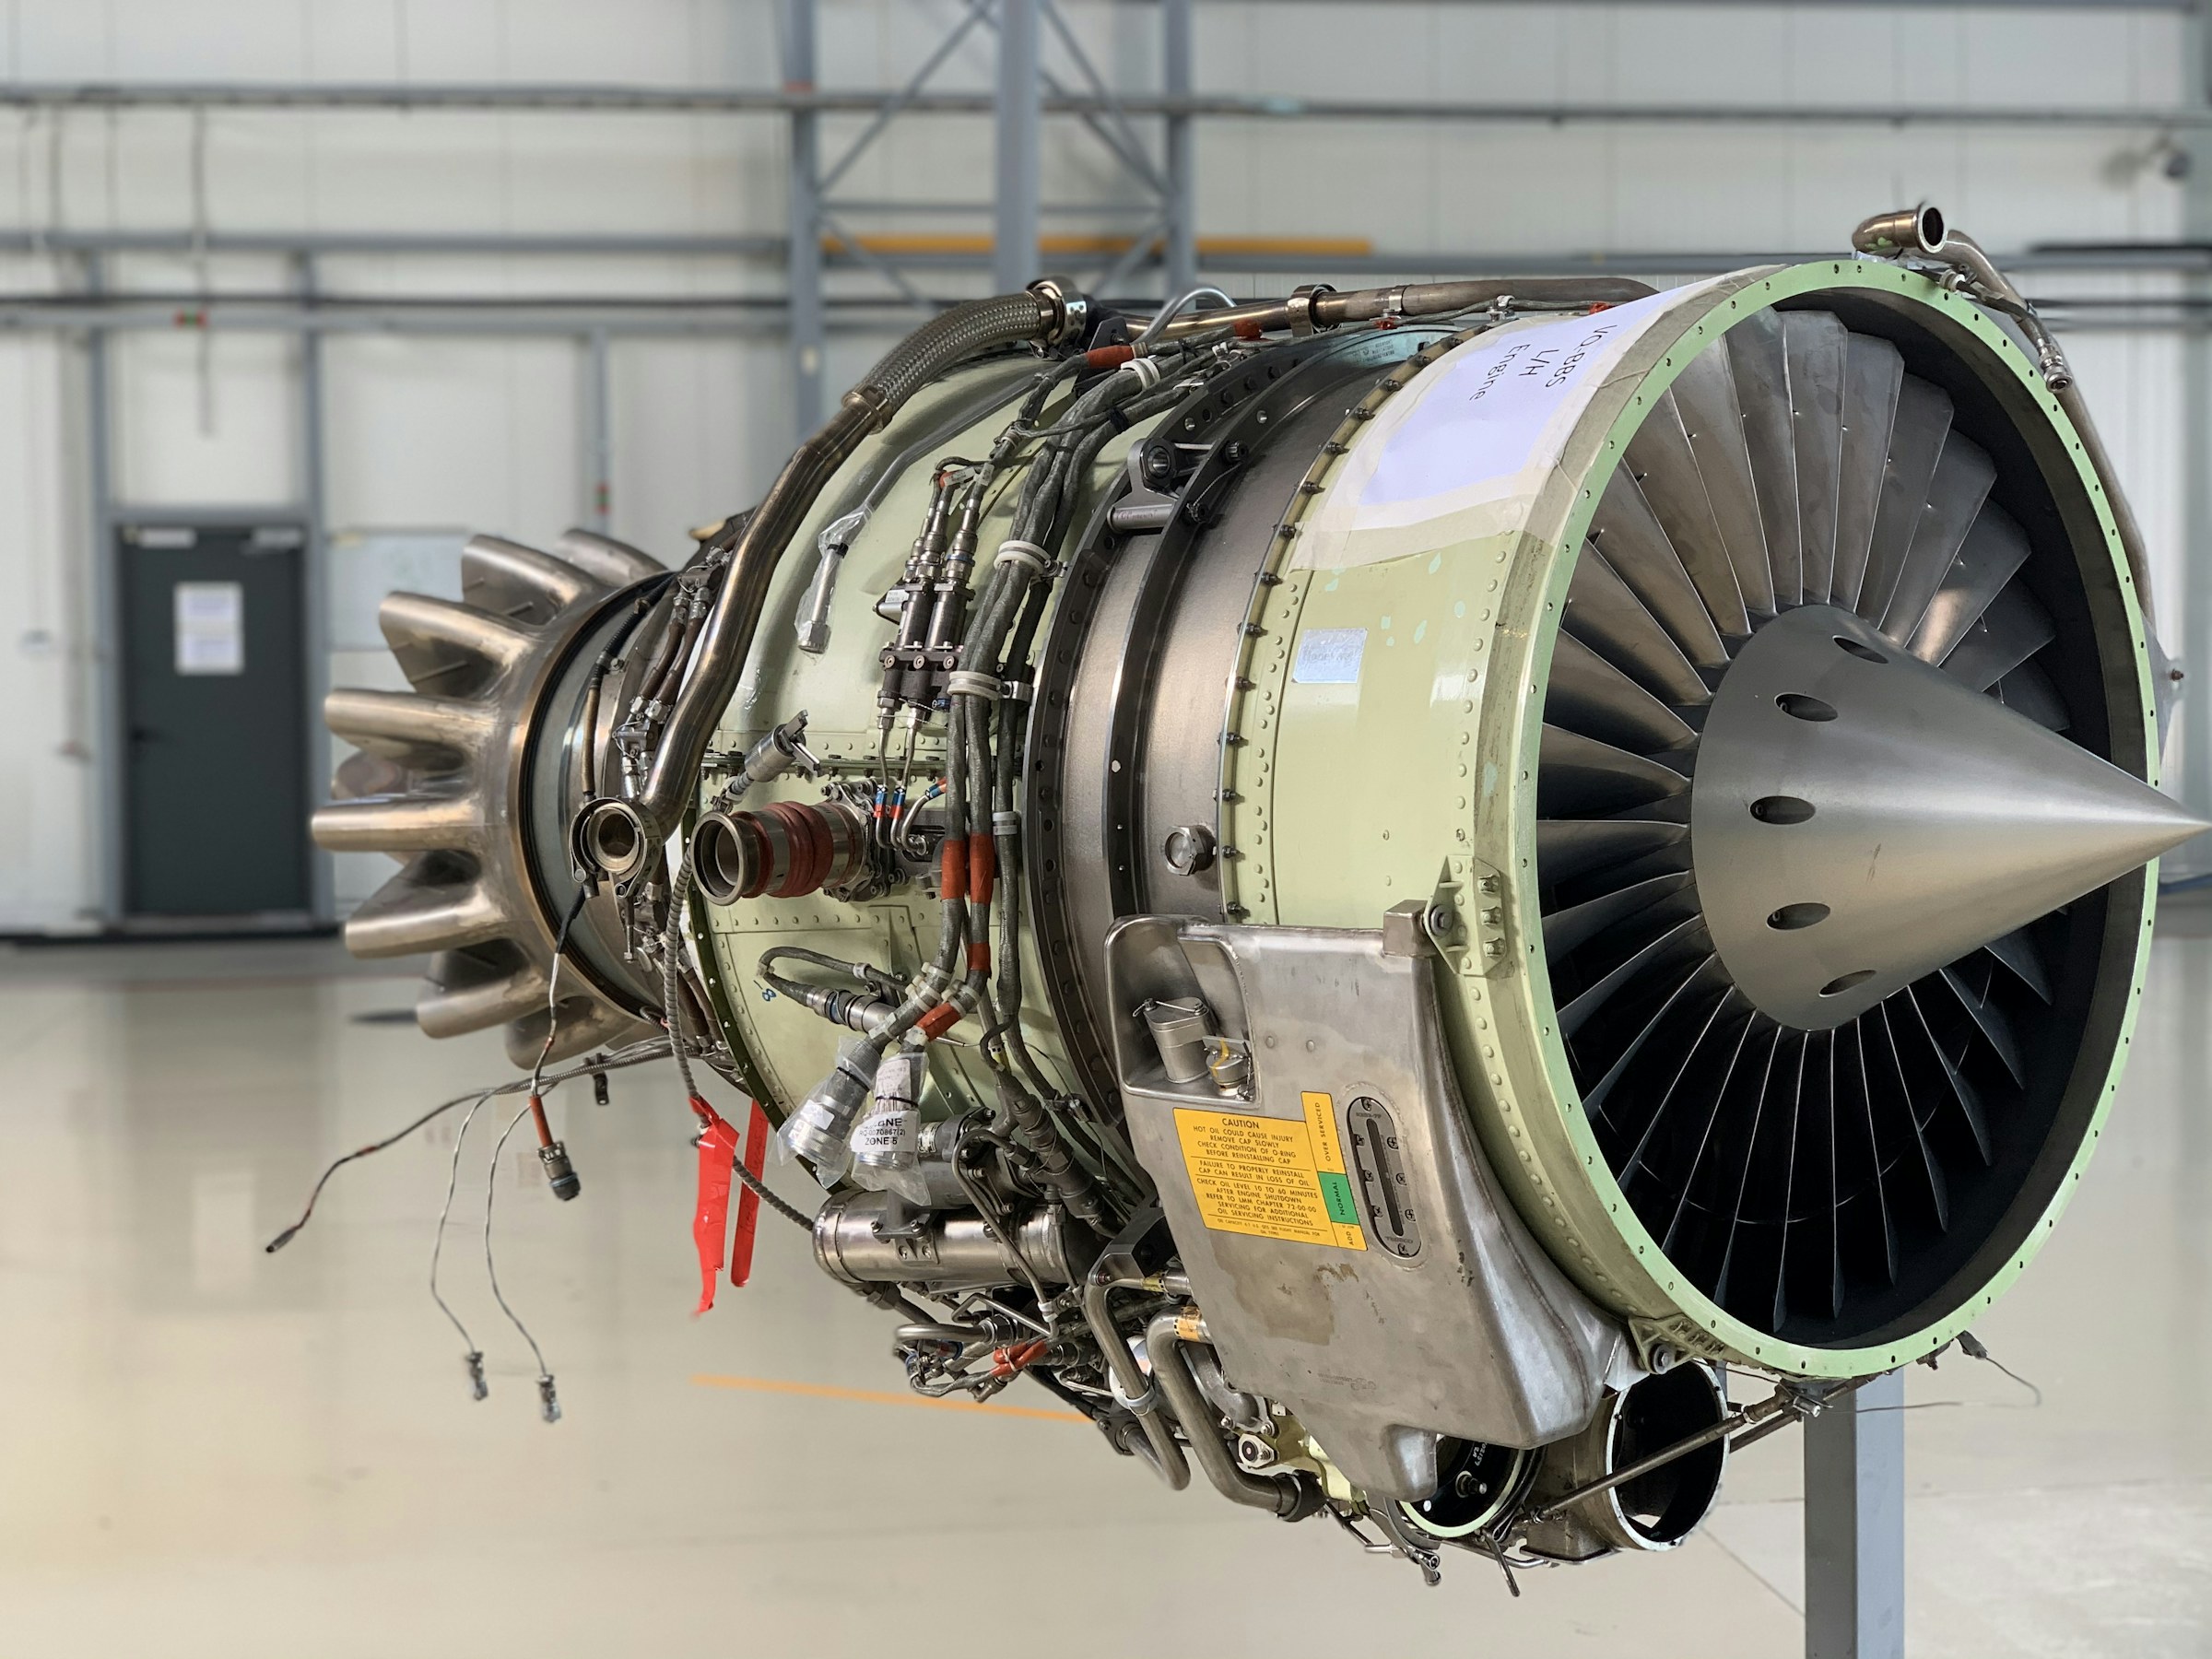
MRO industrial machinery and aircraft maintenance environment

Definition

What is the MRO super cycle?

The phrase gets used loosely. We use it precisely. The MRO super cycle is the convergence of four structural forces — fleet growth, fleet aging, OEM delivery backlogs, and a hard ceiling on certified-inspector labor — into a decade-long surge in maintenance demand the industry's existing labor model was not built to absorb. Oliver Wyman's forecast puts the global MRO market at $119.7B in 2025 and $156B by 2035, a 2.7% CAGR sustained across the full decade.

Source: SiteUpdate/CMS_CONTENT_PLAN.md §Article 1 / Oliver Wyman MRO Forecast 2025–2035.

This is not a post-COVID rebound that normalizes in eighteen months. Each of the four curves is anchored in physical assets — airframes, training pipelines, factory throughput — that do not respond to a hiring memo or a board resolution. And the cycle overlaps with the FAA's July 2025 transition to mandatory digital maintenance records for all Part 145 repair stations, pushing the entire industry toward data-native inspection workflows whether individual operators are ready or not.

The bottleneck is not capital. Airlines have the budget; lessors have the appetite. The bottleneck is throughput in the shop and certified hours on the inspection floor — both bounded by people the industry can no longer produce fast enough. Solving it requires technology that changes the cost-per-inspection and labor-per-inspection equation by an order of magnitude. That is the thesis. The next sections walk the four drivers.


Driver 1 · Fleet growth

9,300 more aircraft, same inspection model.

The global commercial fleet is forecast to grow from roughly 29,000 aircraft in 2025 to 38,300 by 2035 — a net addition of 9,300 airframes in ten years, concentrated in Asia-Pacific, the Middle East, and Africa. Every one of those airframes carries 25 to 30 years of recurring maintenance demand built into the warranty book the day it leaves the factory.

Source: DataRoom_v2_C/07.Supplementary/README.md §Macro Thesis; SiteUpdate/MARKET_BRIEFS.md Brief 1.

A narrowbody in commercial service hits about 100 inspection cycles per year between line maintenance, A-checks, and the heavier C- and D-check intervals. Add 9,300 aircraft and you have added on the order of 930,000 incremental inspection events per year into a global MRO network whose hangar capacity, NDT certified labor, and parts supply chain are already running at or near saturation. Emerging-market carriers — IndiGo, Riyadh Air, Saudia, Vietjet, the Gulf hubs — are not absorbing this growth on top of legacy infrastructure; they are building shops from scratch, often in locations where the local pool of Part 66 / Part 147 trained technicians does not yet exist. For incumbent operators in North America and Europe, fleet growth is the easier piece. The other three drivers are what make the curve bend.

Driver 2 · Fleet aging

Average age, 13.4 years, climbing.

The world fleet is older than it has ever been. Average commercial airframe age has reached 13.4 years globally — a figure that masks the underlying distribution, because the long tail of in-service 737NGs, A320ceos, 777-200s, and A330s pulls the heavy-maintenance demand curve upward year over year.

Source: DataRoom_v2_C/07.Supplementary/README.md §Macro Thesis; SiteUpdate/MARKET_BRIEFS.md Brief 1 §Key Pain Points.

Older airframes do not require linear maintenance. They require exponential maintenance. C-check intervals tighten. D-checks — the heaviest inspections, where the aircraft is stripped to primary structure — arrive sooner and surface more nonroutine findings. A 737NG flying its third heavy check generates two to three times the nonroutine task volume of a 737NG flying its first. The widebody side runs the same play on a longer wavelength: 777-200ERs and early A330s that were supposed to retire on a 2024–2027 schedule are flying through to 2029–2032 because their replacements are landing late.

The inspections themselves get harder. An older composite-skin panel has more substrate damage to characterize. An older aluminum fuselage has more corrosion to grade. An older engine has more borescope findings per cycle. A fixed pool of certified inspectors is being asked to interpret a more complex defect distribution on more aircraft, more often — unsustainable without tooling that augments what one inspector can resolve in a shift.

Driver 3 · OEM backlog

17,000 jets in the queue. Old aircraft cannot retire.

Boeing and Airbus together hold a combined orderbook of more than 17,000 aircraft waiting to be built. At current OEM throughput rates, that backlog represents roughly a decade of production at full capacity — and OEM throughput has been below full capacity for every quarter since 2019.

Source: SiteUpdate/CMS_CONTENT_PLAN.md §Article 1 (Driver 3); DataRoom_v2_C/07.Supplementary/README.md §Macro Thesis (14K OEM backlog low estimate).

This is the second-order effect that compounds Drivers 1 and 2. When a replacement delivery slips 18, 24, 36 months — routine across the post-2019 era — the only viable adjustment is to keep the outgoing aircraft flying past its originally planned retirement date. That aircraft does not fly its final years cheaply. It flies them through the heavy end of its maintenance curve, generating disproportionate inspection demand right when the operator was supposed to be transferring that demand to a new airframe.

The downstream effect on the MRO network is severe. C-check and D-check slot availability at major heavy MROs is booked 12 to 24 months out. XS Aviation's analysis puts AOG event cost at up to $150,000 per hour for grounded commercial aircraft, with a three-day AOG event clearing $600,000 in combined repair, lost revenue, and passenger disruption. Cut the inspection portion from six hours to twenty-five minutes and you do not just save labor — you shrink the operator's revenue-loss exposure by a multiple of the hourly AOG cost.

Source: SiteUpdate/MARKET_BRIEFS.md Brief 1 §Key Pain Points (1).

These three curves all intersect in the next five years, and there is no human-labor fix. The only way out is autonomous inspection.

— Arachnid Systems, Flux Capacitor application (DataRoom_v2_C/07.Supplementary/README.md)

Driver 4 · Labor

37,000 missing mechanics by 2028. 716,000 missing by 2042.

The labor curve is the one that breaks the system. North America was short 18,500 certified aviation mechanics in 2025. Oliver Wyman has that gap doubling to 37,000 by 2028. IATA's 2042 horizon puts the global shortfall at 716,000 maintenance technicians — an order-of-magnitude problem at the scale of the entire commercial industry.

Source: SiteUpdate/CMS_CONTENT_PLAN.md §Article 1 (Driver 4) / Oliver Wyman; IATA workforce projections.

For the fourth consecutive year, two-thirds of MRO industry respondents name labor shortage as the single largest disruptor — ahead of supply chain, regulatory cost, and demand volatility. The NDT inspector pool is the most acute sub-segment: a projected 20% shortage of Level III NDT technicians by 2026 and 40% of the current NDT workforce expected to retire within the decade. The certification pipeline is the lock on this curve — Level II NDT certification requires 280+ hours of method-specific experience plus 530 hours of total NDT experience; Level III requires multiple years of cross-method field experience. You cannot accelerate a credentialed inspector by paying more for one.

Source: SiteUpdate/MARKET_BRIEFS.md Brief 1 §Key Pain Points (2–3) and §Key Statistics (3).

The defense side mirrors the commercial story on a faster clock. The DoD projects a 48,000-aviation-mechanic shortage by 2027. The CV-22 Osprey fleet sits at 30.45% mission-capable against a 75% target — a readiness gap traceable in part to the inspection-throughput ceiling on a complex tiltrotor airframe with intricate certified inspection burdens. The labor crisis is symmetric across both sectors, which is why the technology answer has to be too.

Source: DataRoom_v2_C/07.Supplementary/README.md §Macro Thesis (CV-22 datapoint).

Compounding

Why these four make a super cycle.

Any one of these drivers, on its own, the industry could absorb. More aircraft? Train more mechanics. Older fleet? Build more hangar capacity. Delivery backlog? Wait. Labor shortage? Pay more. The reason this is a super cycle and not a four-quarter pain cycle is that all four are running at once, and they reinforce each other on the way up.

More aircraft means more inspections. Older aircraft means each inspection takes longer and surfaces more findings. The delivery backlog means the older aircraft do not exit the fleet. And the labor curve says the inspection workforce that has to absorb all of it is shrinking, not growing. Multiply the four together and you get an industry running an inspection workload that is structurally over capacity for the next ten years. Manual inspection events on a 737-class narrowbody are routinely priced at $1,200 to $1,800 per inspection — at 100 inspections per aircraft per year, that line-item runs $120K–$180K per airframe per year before parts.

Source: DataRoom_v2_C/06.Traction/README.md §ATLAS Performance (manual baseline).

The McKinsey data on industry response is telling: 56% of MRO organizations name predictive maintenance as a top digital priority, but only 6% have integrated digital and analytics at scale. Only 16% of attempted digital transformations in MRO sustain change long-term. The intent is there; the execution is the bottleneck. That gap is what creates the opening for autonomous inspection — a category that does not require an operator to first solve their digital transformation backlog, because the platform is digital out of the box.

Source: SiteUpdate/MARKET_BRIEFS.md Brief 1 §Key Pain Points (5).

The release valve

Why autonomous inspection is the pressure release.

The super cycle cannot be solved by hiring. The math does not work — the experience-hour bottleneck on Level II / III NDT certification is years long, and the existing pool is retiring faster than it is being replenished. The only viable response operates on a different axis: change the cost-per-inspection and labor-per-inspection equation by an order of magnitude through automation.

The early data on what this looks like in production is clear. ATLAS, verified in a 90-day engagement at a Tier-1 commercial MRO on a 737-800 airframe, ran 98.3% defect-detection accuracy on a 23-minute inspection cycle — against a manual baseline of 60–70% accuracy on a 6+ hour cycle, with 3–4 mechanics in the loop. Cost per inspection on the verified configuration ran $163–$325 versus $1,200–$1,800 manual. Critical-area coverage on the autonomous pass measured 99.5% against 60–70% manual.

Source: DataRoom_v2_C/06.Traction/README.md §ATLAS Performance (a Tier-1 commercial MRO 90-day validation).

At fleet scale this is not subtle. A single-airframe annual inspection-line saving runs $88K–$164K. On a United Airlines 737 fleet — roughly 1,000 narrowbody airframes — the implied annual inspection line moves from $1.3B to $65M. The number does not require fewer mechanics in the broader MRO operation; it requires fewer mechanics on the line-inspection task specifically, which is the most certified-labor-bound activity on the floor. The rest of the maintenance workflow — repair, part replacement, engineering disposition of findings — still uses every certified hour the industry can produce.

The category is moving fast. The predictive airplane maintenance market is forecast to grow from $5.35B in 2026 to $18.87B by 2034 — a 17.1% CAGR, faster than the underlying MRO market because the digital layer captures disproportionate value as it scales. Reference cases are mounting: GE Aerospace's predictive engine-maintenance program has delivered 60% earlier failure detection and 33% fewer unscheduled engine removals; AI and IoT-driven predictive maintenance programs industry-wide are reporting up to 70% reductions in unplanned downtime and 25–30% cost reductions on the maintenance line.

Source: SiteUpdate/CMS_CONTENT_PLAN.md §Required Data Points (7–8); SiteUpdate/MARKET_BRIEFS.md Brief 1 §Key Statistics (12).

Cut a six-hour inspection to twenty-three minutes at 98.3% accuracy, and the ROI case writes itself. The harder question is what the industry looks like once that becomes the baseline.

2026–2031

What the next five years look like.

The super cycle does not resolve. It plays out. Here is the rough shape of the next five years, anchored against the regulatory and labor curves already locked in.

2026. FAA Part 108 — the BVLOS regulatory framework — enters the operational rulemaking phase that enables scaled autonomous inspection deployment. The July 2025 digital records mandate has had a year to settle, and Part 145 repair stations are running fully digital workflows. Early adopters are doing 90- to 180-day in-service engagements at the major commercial MROs.

2027. Predictive maintenance coverage at leading carriers reaches roughly 87.5% of critical aircraft systems. Caprico's seven-phase FAA records-integration pathway crosses the Phase 3 / Manuals Integration threshold for the first autonomous inspection programs — the point at which an autonomous inspection becomes a legally distinct, manual-authorized maintenance procedure.

2028. The North American mechanic shortage peaks at 37,000. Autonomous inspection becomes the standard tool for narrowbody pre-flight and A-checks at any operator running 50+ airframes; operators that have not deployed are paying a measurable cost-per-inspection premium and slot-availability penalty against operators that have.

2029–2030. Digital-twin integration reaches operational maturity. Condition-based maintenance replaces calendar-based maintenance for the leading legacy airlines. The fleet learning network — the cross-operator dataset of defect patterns and predictive signals — becomes the principal moat in the category.

2031. Global MRO market exceeds $140B against the $156B 2035 endpoint. Autonomous systems handle 40%+ of routine inspection tasks in the commercial sector. The DoD has cleared the 48,000-mechanic shortage on its critical platforms by absorbing the same technology through a parallel acquisition pathway — and readiness numbers on platforms like the CV-22 have moved.

Source: SiteUpdate/CMS_CONTENT_PLAN.md §What the Next 5 Years Look Like.

Bottom line

Four takeaways.

If you carry one thing out of this analysis, carry this: the MRO super cycle is structural. It does not resolve with a good year of training-program throughput or a quarter of supply chain easing. It is a decade-long market reorganization.

One. The four drivers — fleet growth from 29,000 to 38,300 aircraft, average age at 13.4 years, 17,000-aircraft OEM backlog, and a 37,000-mechanic North American gap by 2028 — are running simultaneously and reinforce each other. None has a near-term reversion path.

Two. The labor curve is the binding constraint. The certification pipeline is years long, the retirement curve is accelerating, and no compensation strategy compresses the experience-hour requirements that govern certified inspector qualification.

Three. Autonomous inspection is the only response that operates on the right axis. Verified platforms are running 98.3% accuracy on 23-minute cycles in production — an order-of-magnitude shift in both cost and labor against the manual baseline. The category is growing at 17.1% CAGR; the underlying MRO market is growing at 2.7%.

Four. Operators investing in the technology now are buying not only the unit economics — they are buying first access to the fleet-learning networks that will define competitive defensibility in the back half of the decade. Operators waiting will face escalating cost-per-inspection, deteriorating slot availability, and a widening competitive gap against operators that did not wait.

Continue reading

Related dispatches.

The super cycle in adjacent frames — workforce, sensors, and FAA records.

Aircraft in flight
Workforce · May 2026

40,000 Mechanics Short by 2028: The Aviation Workforce Crisis

North American aviation maintenance is 40,000 technicians short by 2028. Training a certified inspector takes 18–24 months. The defense side faces the same gap on a faster clock.

Read
Multi-spectral data pattern
Technology · June 2026

Six Sensors, One Platform: Multi-Spectral vs. Visual-Only Inspection

Donecle uses one sensor. Gecko uses two. ATLAS integrates six — hyperspectral, LWIR thermal, LiDAR, laser profilometry, radar NDT, polarimetric RGB.

Read
Helicopter cockpit operation
Regulatory · July 2026

The FAA-Records Moat: Why Manuals Integration Is the Hinge

Seven phases from classification to industry standard. Phase 3 — Manual Integration into GMM/CAMP and RSM/QCM — is where autonomous inspection becomes legally distinguishable.

Read

Schedule a demo

See ATLAS run an inspection.

If your operation is sitting somewhere on the four-driver curve — fleet growth, fleet aging, deferred replacements, certified-labor ceiling — the conversation starts with the inspection workflow that is hardest to staff today. Tell us which one, and we will model your fleet against it.

Schedule a demo ben@arachnidsys.com
ARACHNID arachnid systems